Quick facts
- Banding fertilizer directly on the seed can be an effective way to supply small amounts of macro- or micro-nutrients to a crop.
- Starter fertilizer can significantly increase plant growth early in the growing season.
- Both salt and ammonia can cause damage to plant tissue.
- Soil type can also affect seed safe fertilizer rates.
- Keep application rates of all fertilizer sources low to reduce the risk of damage and give the best change for an economic return.
- Maintaining at least two inches of soil between the band and the seed row is sufficient to reduce the risk of starter damage.

Cool and wet soil conditions can limit uptake of immobile nutrients early in the growing season. Banding fertilizer with the corn planter is a popular method of supplying nutrients to corn and banding can increase uptake early in the growing season.
As planter size has increased more corn farmers have turned to liquid fertilizers banded directly on the seed because the equipment required is simple, making handling liquid fertilizers easier.
Banding fertilizer directly on the seed, also known as "in-furrow" or "pop-up" placement, can be an effective way to supply small amounts of macro- or micro-nutrients to a crop. Placing fertilizer directly on the corn seed does pose a risk as fertilizer materials can damage plant tissue, reducing plant growth and seed germination.
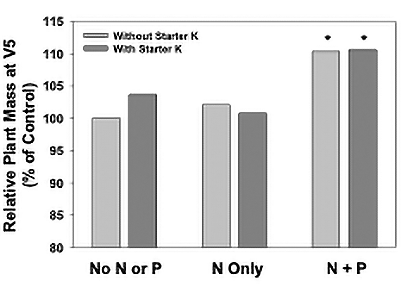
The most noticeable effect of starter fertilizer is the increase in plant growth early in the growing season. This effect can be seen even if broadcast fertilizer is applied. Small amounts of fertilizer can significantly increase plant early growth. In the example in the graph, a 2.5 gallon per acre rate of 10-34-0 increased early plant growth by an average of 15% while there was only a small additional increase (1-2%) from either 5 or 7.5 gallons per acre. High rates of liquid fertilizers may not be needed to increase early plant growth.
Nutrient-specific effects
Some nutrients in seed placed fertilizers have a greater effect on early growth responses than others.
- Seed placed phosphorus (P) increases early plant mass more than nitrogen (N) and potassium (K). Application of P will generally increase early plant growth even in the presence of high soil test P.
- Seed placed N, K, or S may appear to increase plant mass early in the season but differences are a result of low N, K, or S concentration in the soil solution which is limiting growth.
- Choosing a P seed placed fertilizer source that can economically supply at least 10 pounds of P2O5 per acre is important if increased plant mass is a goal.
Tips for using seed placed starter
Keep rates low
Fertilizer placed in the seed row can have a positive benefit on corn growth early in the growing season and potentially on corn grain yield. High rates of salt and nitrogen products that liberate ammonia (NH30) can have negative effects reducing plant growth and the number of emerged plants. Keep rates low to reduce the risk for damage but still get positive benefits from applying seed-placed fertilizer.
Account for nutrients in the starter
Account for the amount of total nutrients applied in the starter in an overall fertility program. While the amount of total nutrients may be low, reducing the amount of a particular nutrient broadcast by the rate applied in the starter makes economic sense. Knowing what is being applied by all fertilizer sources in a fertility program helps to keep costs as low as possible and prevent over application of nutrients.
Monitor soil test values
Many corn producers use starters to enhance their broadcast fertility program. When money is tight, you might rely on seed-placed fertilizer to supply all needed plant nutrients. But a low input program will result in a gradual decline in soil test values over the long-term.
If soils begin to test low, you may want to use some broadcast fertilizer to increase grain yield and profitability within a given field or field area. Pay attention to soil tests to know when you can reduce seed-placed fertilizer rates in areas where there may be no benefit.
Chose a product that will be economic and fit with your goals
With so many different product sources available to growers, the best way to select between them is to identify the product that will meet production goals. The best way to compare products is to evaluate the overall cost of the product versus the amount of total nutrients purchased. Choosing a product that will meet your goals with the least cost can help ensure the cost of the product can be recovered with additional grain yield.
Damage potential of seed placed fertilizers
There are two factors to consider when determining the potential damage a fertilizer source may cause. First, all fertilizers contain salts. In low concentration, salts will typically have little impact on the growth of a crop. All salts by nature are formed by ionic bonds that give the materials a slightly polar charge.
Water is a polar molecule and will be attracted to any positively charged molecules in the soil. If the charge is in a high enough concentration, such as in a fertilizer band, ions can hold water strongly and will also draw water out of tissues resulting in damage to growing tissue and reduced seed germination.
The second factor to consider is the potential for ammonia (NH30) to form in the band near the seed. Ammonia can damage plant tissue similar to salts.
The salt index of a fertilizer is a measure of the salt concentration of a fertilizer in the soil solution. Salt index is an important parameter to consider when comparing fertilizer products and their suitability for seed placement.
Table 1. Salt index values of fertilizer materials (table adapted from Mortvedt, 2001)
| Material | % N | % P2O5 | K2O | S | Per unit of nutrients* |
|---|---|---|---|---|---|
| Ammonia | 82 | 0 | 0 | 0 | 0.572 |
| Ammonium Nitrate | 34 | 0 | 0 | 0 | 3.056 |
| Ammonium Sulfate | 21 | 0 | 0 | 24 | 3.252 |
| Ammonium Thiosulfate | 12 | 0 | 0 | 26 | 7.533 |
| Urea | 46 | 0 | 0 | 0 | 1.618 |
| 28% UAN | 28 | 0 | 0 | 0 | 2.25 |
| 32% UAN | 32 | 0 | 0 | 0 | 2.221 |
| APP (10-34-0) | 10 | 34 | 0 | 0 | 0.455 |
| DAP (18-46-0) | 18 | 46 | 0 | 0 | 0.456 |
| MAP (11-52-0) | 11 | 52 | 0 | 0 | 0.405 |
| Phosphorus Acid | 0 | 54 | 0 | 0 | 1.613** |
| 0 | 72 | 0 | 0 | 1.754** | |
| Mono-potassium Phosphate | 0 | 52 | 35 | 0 | 0.097 |
| Potassium Chloride | 0 | 0 | 62 | 0 | 1.936 |
| Potassium Sulfate | 0 | 0 | 50 | 18 | 0.852 |
| Potassium Thiosulfate | 0 | 0 | 25 | 17 | 2.72 |
- *One unit of nutrients = 20 lbs.
- **Salt index is calculated per 100 lbs. of H3PO4
- APP = ammonium polyphosphate
- DAP = di-ammonium phosphate
- MAP = mono ammonium phosphate
- UAN = urea ammonium nitrate solution
Salt index is a unitless measure that is expressed as the ratio of the increase in osmotic pressure a fertilizer source induces to the same weight of sodium nitrate (NaNO3). Sodium nitrate has a relative osmotic value of 100. Sodium nitrate was used as a baseline because it was a common fertilizer source when the concept of salt index was developed. All salt index values are expressed as per unit nutrients. For most fertilizer sources one unit of nutrients equals 20 pounds For acids, 100 pounds is used for calculating nutrient units.
The salt index of a fertilizer source is not directly measured but rather is calculated based on the salt index values of the components of a fertilizer source, as in Table 1. The next table summarizes the calculation of 7-21-7. To calculate the salt index of 7-21-7:
- List all fertilizer materials and weight for each component per ton of material (columns 1 and 2) in the fertilizer blend.
- Determine the nutrient units in columns 3-5 by multiplying the total pounds of material by the concentration of N, P, K or S.
- List the salt index per plant nutrient unit from Table 1 into column 6.
- Determine the salt index from each component by multiplying the sum of the nutrient units from columns 3-5 by the per unit salt index value in column 6.
- Add the salt index values from each component together to determine the salt index of the material.
Table 2. Calculating salt index of 7-21-7
| Material | lbs./ton | N | P2O5 | K2O | Per unit | Salt index in formulation |
|---|---|---|---|---|---|---|
| (1) | (2) | (3) | (4) | (5) | (6) | (7) |
| APP | 1235 | 6.2 | 21 | 0.455 | 12.4 | |
| 28% UAN | 57 | 0.8 | 2.25 | 1.8 | ||
| KCl | 223 | 7 | 1.936 | 13.6 | ||
| Water | 482 | |||||
| 2000 | 7 | 21 | 7 | 27.8 |
This example was taken from Mortvedt (2001). Nutrient units are in pounds.
- APP = ammonium polyphosphate
- UAN = urea ammonium nitrate solution
- KCl = potassium chloride
Salt index values of common fertilizer materials are given in Table 3.
- Fertilizer sources with a salt index of 20 or less are best suited for in-furrow placement.
- Most fertilizer sources with salt index values less than 20 were manufactured from potassium phosphate instead of potassium chloride.
- Do not use fertilizer sources with a salt index greater than 20 for in-furrow placement.
It is important to note that the salt index is not a direct measurement of the amount of fertilizer that can be safely applied in the seed row.
Table 3. Salt index of common liquid starter formulations
| Formulation | Salt index |
|---|---|
| 3-18-18* | 8.5 |
| 6-24-6* | 11.5 |
| 6-30-10* | 13.8 |
| 9-18-9* | 16.7 |
| 10-34-0 | 20 |
| 7-21-7 | 27.8 |
| 4-10-10 | 27.5 |
| 28% UAN | 63 |
*Potassium phosphate is used as the K source.
Ammonia (NH30) can damage plant tissue similar to salts.
Nitrogen contained in liquid fertilizers can be in any of three forms, ammonium (NH4+), nitrate (NO3-), or urea. Of these three, ammonium and nitrate can contribute to the salt content of the fertilizer but do not have the same damage considerations as ammonia.
The exception to this rule is ammonia on high pH soils. Soil pH controls the relative percentage of ammonia to ammonium in the soil. The percentage of ammonium is greater as soil pH increases. When ammonium is applied to a high pH soil a portion can be converted to ammonia. Urea can result in the greatest accumulation of ammonia in the band as ammonia is formed as an intermediary in the conversion of urea to ammonium.
UREA 🡪 NH3 + H2O 🡪 NH4+ + OH-
Do not use dry urea as an in-furrow fertilizer source. Many common liquid fertilizer sources contain some urea as part of the total N in the fertilizer (Table 4). Research in Minnesota has indicated fertilizer sources that contain materials that will liberate NH30 in the seed furrow can be more damaging than fertilizers that contain high amounts of salts.
In order to mitigate the potential for stand loss, use materials such as 28% or 32% UAN solutions for band application on the soil surface or banded away from the seed row with at least one inch of soil between the seed row and fertilizer band (for example, a starter placement).
Table 4. Range in urea content for fertilizer sources expressed as a percentage of the total nitrogen in the fertilizer source
| Product | Urea (% of total nitrogen content) |
|---|---|
| 10-34-0 | 0 |
| 6-24-6 | 0-5 |
| 4-10-10 | 1-5 |
| 7-21-7 | 1-5 |
| 3-18-18 | 3-7 |
| 9-18-9 | 10-15 |
| 10-10-10 | 10-25 |
| 28% UAN | 28-35 |
Damage from thiosulfate
")
- The thiosulfate ion in liquid starter fertilizers can be highly damaging to plant tissue.
- Ammonium thiosulfate and potassium thiosulfate, contain the thiosulfate ion.
- Ammonium thiosulfate can liberate free ammonia in the seed furrow.
- Potassium thiosulfate is safer but should not be applied at high rates in the seed furrow.
If sulfur is required in a starter fertilizer blend, alternative sources should be used as placement of thiosulfate directly with the corn seed can be very risky. Consider alternative placement methods such as a surface band or starter band at least one inch away from the seed row when using a fertilizer source containing thiosulfate.
Measure the damage potential of fertilizers by evaluating the number of plants emerging following fertilizer application and comparing it to a control or untreated area. Plant emergence does not give the full picture of damage potential as reduced plant growth may occur before the fertilizer decreases the number of plants per acre.
In a research sample, the final number of emerged plants following an in-furrow application of ammonium thiosulfate (ATS) was not noticeable until rates exceeded 5 gallons per acre. The mass of plants above ground steadily decreased even with the lowest rates of ATS applied.
Reducing the damage
Over-application of most fertilizer sources, especially in-furrow application, will eventually lead to reductions in plant mass and plant population. Keeping application rates of all fertilizer sources low makes the most sense to reduce the risk of damage and give the best change for an economic return.
Placement options have been developed to reduce the damage potential of liquid starters placed in-furrow. One of these methods is a dual band of fertilizer placed to both sides of the seed row slightly above the seed on the side of the furrow (dual band above).
Data from a sandy soil indicates that this placement was no better or worse than traditional placement with the seed or a single band placed above the seed row, when applying a high rate of multiple fertilizer sources (Table 5). The 10-34-0 fertilizer source contained the most total N at the low and high rates and resulted in the greatest reduction in stand.
What is important to note is there were no differences among the placement methods. Maintaining at least two inches of soil between the band and the seed row is sufficient to reduce the risk of starter damage. Most placement methods within a half of an inch from the seed row should be viewed similarly to placement directly on the seed.
Table 5. Corn emergence from fertilizer sources applied in the furrow on a sandy soil with three different placement methods (Benton Co., 2004)
| Dual band above | High | Low |
|---|---|---|
| 10-34-0 | 81* | 99 |
| 4-10-10 | 110* | 106 |
| 3-18-18 | 100 | 109 |
| With seed | High | Low |
| 10-34-0 | 88* | 108 |
| 4-10-10 | 112* | 107 |
| 3-18-18 | 106 | 102 |
| Single band above | High | Low |
| 10-34-0 | 84* | 107 |
| 4-10-10 | 111* | 103 |
| 3-18-18 | 114 | 103 |
* Numbers significantly differ from the control (no seed placed fertilizer). The control plot had no starter fertilizer applied. Values are the percent of emergence compared to the control.


Soil type and other considerations
Soil chemical properties can have a significant impact on the amount of fertilizer that can be safely applied with the corn seed. The most important property of a soil is the cation exchange capacity (CEC).
The CEC is a measure of the amount of positive ions a soil will hold. All salts contain positive and negative ions. Soils with a greater CEC can reduce the risk of salt damage from high rates of fertilizer. Soils with high CEC in Minnesota typically have greater concentration of organic matter, which affects the water holding capacity of the soil.
When liquid fertilizers are placed in the seed row of a soil with a greater water holding capacity, the risk of seedling damage is decreased when water is at field capacity. As soils dry, the risk for damage from fertilizer salts or free ammonia greatly increases.
Maximum seed safe rates for common fertilizer sources on loam and sandy soils are given in Table 6. The “High” application rate reported in the table represents the maximum rate that could be applied given adequate soil moisture at planting. The “low” rate reported is for situations where moisture is limiting.
The rates given in Table 6 were found to result in similar emergence and growth compared to when no starter was applied. The fertilizer rate that produced the greatest plant growth was typically similar to the “low” value.
The rates given in Table 6 do not guarantee damage won't occur within a given year. Fertilizer placement with the seed always presents some risk for damage for all fertilizer sources and rates. The maximum application rate for coarse textured (sandy) soils should be 50% or less than that of soils with loam textures.
An accepted theory for application of in-furrow starter fertilizers states that you should apply no more than 10 pounds per acre of N + K2O in the furrow for corn. The data in Table 6 supports the notion of no more than 10 pounds per acre of N + K2O applied directly on the corn seed.
For sandy soils, do not apply more than 4 pounds of N + K2O. The general guideline does not apply for products such as ammonium thiosulfate or products that have potassium phosphate as the source of K (low salt sources).
Only nitrogen needs to be considered for low salt sources. However, high rates of N in low salt sources can still result in damage from nitrogen (particularly urea) and are seldom economical.
Table 6. Estimated range in maximum rates of fertilizer that can be applied on the corn seed and produce emergence and early growth similar to when no starter was applied*
| Source | Analysis %** | Low lb./acre | High lb./acre | Low gal./acre | High gal./acre |
|---|---|---|---|---|---|
| Loam soils | |||||
| AMS | 21-0-0-24 | 18.8 | 29.1 | ||
| APP | 10-34-0 | 63.4 | 98.2 | 5.4 | 8.4 |
| ATS | 12-0-0-26 | 13.9 | 21.9 | 1.3 | 2 |
| DAP | 18-46-0 | 43.8 | 67.5 | ||
| 7-21-7 | 7-21-7 | 45.6 | 71 | 4.2 | 6.5 |
| KCl | 0-0-60 | 10.7 | 16.6 | ||
| KTS | 0-0-25-17 | 18.8 | 29.1 | 1.5 | 2.4 |
| 9-18-9 | 9-18-9 | 76.4 | 117.9 | 6.9 | 10.7 |
| MAP | 11-52-0 | 47.3 | 73.7 | ||
| UAN | 28-0-0- | 20.1 | 31.3 | 1.9 | 2.9 |
| Urea | 46-0-0 | 17 | 26.4 | ||
| Sandy soils | |||||
| AMS | 21-0-0-24 | 6.3 | 13.4 | ||
| APP | 10-34-0 | 21.4 | 43.8 | 1.8 | 3.7 |
| ATS | 12-0-0-26 | 4.5 | 9.8 | 0.4 | 0.9 |
| DAP | 18-46-0 | 15.2 | 30.4 | ||
| 7-21-7 | 7-21-7 | 15.2 | 32.1 | 1.4 | 2.9 |
| KCl | 0-0-60 | 3.6 | 7.1 | ||
| KTS | 0-0-25-17 | 6.3 | 13.4 | 0.5 | 1.1 |
| 9-18-9 | 9-18-9 | 25.9 | 52.7 | 2.3 | 4.8 |
| MAP | 11-52-0 | 16.1 | 33 | ||
| UAN | 28-0-0- | 7.1 | 14.3 | 0.7 | 1.3 |
| Urea | 46-0-0 | 5.4 | 11.6 |
*Data are based on data collected in the greenhouse for contrasting loam and sandy soils for common liquid and dry fertilizer sources assuming adequate moisture in the soil at planting.
**Analysis is given in percent of N-P2O5-K2O or N-P2O5-K2O-S.
Consider the influence of liquid in-furrow fertilizer on corn grain yield separately from impacts on early plant growth. Seed placed fertilizer will almost always have a greater impact on early plant growth than on grain yield.
As the corn plant develops, height differences that occurred early in the growing season will disappear. Enhanced early growth can impact corn silking dates. Three years of Minnesota research indicated that corn silking date could be advanced by 1 to 2 days across a range of planting dates and hybrid relative maturities.
Enhanced maturity can impact grain moisture at maturity. Differences in grain moisture at harvest when starter is used will most likely occur when harvesting fields early where grain moisture is in the range of 20-30%.
In dry to average years, in-furrow application can decrease grain moisture from 0 to 1 percentage points. In exceptionally cool and wet years this decrease can be as much as 0 to 2 percentage points.
End of season yield
Increased corn grain yield at the end of the season depends on many factors. In a few cases where soils test high for most nutrients, a grain yield response may be caused by the advancement of growth also termed the "starter effect."
The potential for the starter effect to increase grain yield in high testing soils is low. An increase in grain yield from the starter effect in Minnesota is estimated to occur about 10% of the time compared to a grain moisture reduction, which may occur up to 25% of the time.
Grain yield increases are mainly caused by one or more of the nutrients applied in the band being deficient in soil for a significant part of the growing season. This nutrient deficiency may be caused by a lack of an available nutrient in the soil or the nutrient being temporarily unavailable because of environmental factors such as cold, wet soils.
The addition of micronutrients in seed-placed fertilizers has not been shown to increase the probability of a grain yield response. Zinc may be the only micronutrient of benefit in a seed-placed mix. Use a fully chelated source of zinc to avoid zinc forming complexes with orthophosphate in seed-placed fertilizer mix and precipitating out of solution.
Fallow syndrome is caused by a reduction of the activity of vesicular arbuscular mycorrhiza (VAM) by growing a non-host crop prior to growing corn. A common non-host crop grown in Minnesota is sugar beet or canola.
In soil, VAM colonizes the roots of corn and are important for the uptake of P and zinc (Zn). Fallow syndrome can occur in soils with high soil test P or where broadcast fertilizer is applied and can result in significant loss in grain yield.
Application of 20-30 pounda of P2O5 with 1-2 quarts per acre of fully chelated Zn can reduce the risk for fallow syndrome in corn following sugar beet. The rate of P needed to reduce the risk of fallow syndrome may exceed the previously suggested rates.
If applying fertilizer in the seed furrow to correct fallow syndrome, be certain that the rate of the fertilizer source selected will not result in significant stand loss. It is important to note that growing corn following sugar beet does not guarantee that fallow syndrome will occur.
Mortvedt, J.J. 2001. Calculating Salt Index of Fertilizers, printed in the Fluid Journal; verified 11 March 2015.
Reviewed in 2023